XRF Microanalysis

Smart Wafer
The InnerSense SmartWafer runs through the equipment and records vibrations and accelerations along its route.
After completing the recording process, the wafer is returned to a “FOUP type” docking station and the data is downloaded to a PC.
The data is then synchronized with the equipment sequence of events and compared to the historic “good” fingerprint.
Any abnormal signals indicate and pinpoint bad mechanical components or alignments which are causing particles, defects or scratches on the wafer.
SmartWafer Specifications
Standard 300mm and 200mm wafers are available. A small electronic module (15 gr – 2.5mm thick – 83mm diameter) is bonded to the wafer. Silicon substrate is used to closely match the behavior of a real wafer, so it can run the same mechanical recipe as a regular wafer in the wafer handling system. The electronic circuit is coated with conformal silicon adhesive.
| Sensitivity | 3mG |
| Frequency response | 0Hz – 10KHz |
| Operating temperature | <150 c up to 2min |
| Operating pressure | 10-9 -760 Torr |
| Battery operation time | 3hrs per charge |
300mm SmartWafer II Docking Reading & Charging Station
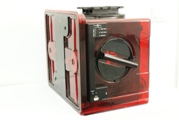
Unlike the previous generation of SmartWafer, the new 300mm Smart Wafer is stationed inside a SmartFOUP Docking station to avoid manual handling of the SmartWafer. It is charged and communicates without any physical contact. The SmartFOUP includes a panel which displays the status of both the Smart Wafer and the SmartFOUP.
SmartWafer Analysis Software
Accelerations: Low frequency signals are used to capture and analyze broad acceleration levels along the X, Y and Z axis. Vibrations: The high frequency range of the SmartWafer records vibrations which may originate from worn-out bearings, physical friction which may shed particles, pump-downs, vents and other moving parts. Vibrations are directly measured along 2 axes but are related to all 3 axes. Data Analysis: Advanced pattern recognition algorithms are used to analyze traces. Any two plots can be overlaid for comparisons and the superimposition of time events for easy tracking. Data download: Typically less than 30secs. Software compatibility: Microsoft Windows, 2000, XP and Vista. A new GUI enables:
- Easy filtering and selection of test.
- Viewing of both high and low frequencies.
- Verifying the wafer leveling.
- Viewing of SPC results of a specific event

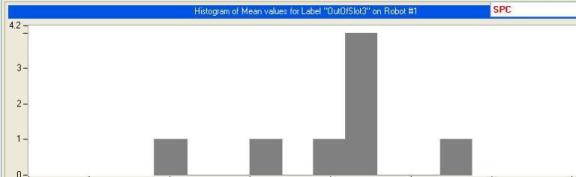
SPC – Statistical Process Control
SPC functionality: Pre-defined mechanical events are measured and quantified. A data point is recorded for each event and for each test. A database is thus created which can be combined with statistical rules to flag any abnormal mechanical event. It can also be used to compare the performance of similar tools. The chart below shows a”Tools Comparison” histogram of a selected event.